Research Article | DOI: https://doi.org/IJPHRE-RA-26-01
Cohort Studies in Health Research: Journey from Exposure to Outcomes
Abstract
Epidemiology is the study of the distribution of disease and its factors, involving observational and experimental studies. Observational studies focus on the distribution of diseases, while analytical studies examine the relationship between disease occurrence and specific factors. Cohort studies are conducted to compare cases and controls to estimate disease risk. Cohort studies, also known as prospective or longitudinal, analyse a group of people over time, focusing on the occurrence of exposure.
Cohort studies are mainly of two types according to the time of disease onset: prospective and retrospective. Prospective cohort studies begin with a presumed cause and progress to the expected outcome, while retrospective cohort studies examine the dependent outcome and its correlation with past causes. In cohort studies, data are analysed using the Odds Ratio (OR), which measures the strength of the association between risk factors and outcomes. Attributable risk or risk difference indicates how much of the disease is attributable to the exposure. Regression analysis was also done in cohort studies to identify the relationship between independent variables with outcomes. Large-scale prospective cohort studies face methodological issues such as selection bias, defining exposure, attrition, and information bias. The Critical Appraisal Skill Program (CASP) checklist serves as a guide for evaluating the cohort studies. STROBE (STrengthening the Reporting of OBservational studies in Epidemiology) intends to create standards for reporting observational research.
Introduction
Epidemiological studies help to understand the distribution and causes of health and disease in communities. They can also help us to identify risk factors, evaluate treatment options, and track illness patterns. The data obtained from epidemiological studies help public health experts to develop effective strategies for improving health outcomes. Epidemiological data is used to create and evaluate disease prevention strategies, as well as to guide patient treatment after illness has occurred. Identifying risk factors for disease incidence is a vital component of epidemiology research [1]. Cohort studies are one sort of epidemiological research design that is used to examine the relationship between risk factors and the onset of disease [2]. Cohort studies are best suited to learn the natural history of a disease. The present article provides a brief overview of various aspects of cohort study designs.
Observational studies in epidemiology
Epidemiology is the basic science that studies how disease spreads in populations and the factors that determine its distribution [1]. There are two different types of epidemiological studies: observational studies and experimental studies [1,2]. In observational research, the investigator observes the distribution of diseases or their etiological factors in human beings and finally finds the variables to which the illness appears to be correlated [2,3]. In experimental research, the researcher does some interventions to change the disease's progression [4].
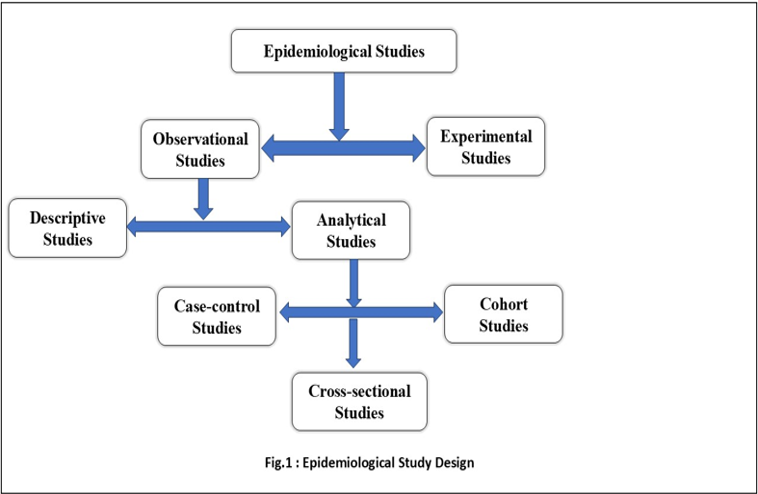
Observational studies can be of two types descriptive and analytical. In a descriptive study, the investigators observe the distribution of disease among individuals or populations. It describes the disease by time (when it occurs?), place (where it occurs?), and person (who is getting the disease?), distribution of the disease [3,5,6]. Here, the focus is to formulate a hypothesis. In comparison to descriptive studies, analytical studies go to a further step, that is they examine the relationship between disease occurrence and factors. Analytical studies test hypotheses about individuals in natural settings. Here the focus is on individuals within the population rather than the entire population. Analytical studies can be further classified into cross -sectional studies, case-control studies and cohort studies [6].
In a cross-sectional study, all measurements are taken on a single occasion or within a short period. In cohort and case-control studies, observations are made over a period. The case-control study proceeds from “effect to cause” which means exposure and disease have already occurred when the study is initiated. Whereas cohort study, works from “cause to effect” which means at the beginning of the study, exposure has occurred but the disease has not happened [6]. An overview of epidemiological study designs is given in Figure 1.
Cohort studies
The word "cohort" originates from the Latin word "Cohors," which means "a group of soldiers that marched together." In clinical research, a cohort refers to a group of participants who are initially identified and then followed [7,8]. Cohort studies are the analytical forms of epidemiological studies where a cohort or group of people is identified with the same characteristics (age, sex, occupation, or cultural characteristics) and observed over some time to determine the cause-and-effect relationship [7–9]. An example of a cohort study could be people born in London in 2000, or it could be pregnant women who smoke. In 1976, a large cohort of registered nurses became participants in the Nurses’ Health Study (NHS), a well-known cohort study conducted by researchers at Harvard Medical School. Cohort studies are also known as prospective studies, longitudinal studies, incidence studies, and forward-looking studies. However, "cohort study" is the most used term[6].
Types of Cohort studies:
In a broader sense, the following types of cohort studies have been recognized based on the period of disease development at the beginning and continuation of the investigation.
- Prospective cohort studies: Prospective cohort studies begin with a presumed cause and progress to the anticipated outcome (disease) while progressing forward in time. When the investigation begins, the outcome (disease) has not yet occurred. Almost all prospective studies start at the present and continue into the future [8,10,11].
Example: A prospective cohort study to investigate one-year mortality after acute stroke in India. Patients admitted to the institution with acute stroke were recruited to the study and followed up for 1 year after the stroke. They examined the death rate in two weeks, two months, six months, and twelve months following discharge of the patients [12].
Retrospective cohort studies
A retrospective cohort study begins with the dependent outcome (disease) and then evaluates if it is correlated with one or more possible causes in the past. The outcomes (diseases) all occurred before the start of the research. The investigator goes back in time, perhaps 10 to 30 years, to select these study groups from existing records of earlier workplace, medical, or other data, and traces them forward through time, from a past date set on the records, usually up to the present [6,8,13].
Example: A group of researchers from Iran conducted a retrospective cohort study to estimate the prevalence of pressure ulcers in COVID-19 patients and the factors that influence them. The researchers found that around 46% of COVID-19 individuals admitted to ICUs had pressure ulcers. Data regarding associated factors were collected from medical records. The study found that factors like Age, Braden score, BMI, comorbidity, diabetes mellitus, stool incontinence, Glasgow coma scale, vasopressor, and length of hospital stay were significantly associated with the development of pressure ulcers[14].
Combination of retrospective and prospective cohort studies/ Ambi-directional study
Both retrospective and prospective phases are incorporated into this form of study. The cohort is identified based on previous records, and the outcome to date is reviewed. The same group will be followed up on in the future to assess outcomes. This is often referred to as ambidirectional design[15,16].
Example: An ambidirectional cohort study was conducted to assess the efficacy of combining HbA1c with fasting plasma glucose (FPG) for determining the progression rate to diabetes mellitus (DM) and to analyse the risk factors for DM in patients with IFG. Patients with IFG who visited the outpatient clinic from October 2014 to October 2017 were recruited from records (the retrospective part of the study), and they were followed until January 2019 to evaluate the incidence of DM (the prospective aspect of the study)[17].
Nested Case-Control Cohort Design
Researchers conduct nested case-control cohort studies by identifying cases of a disease that occur in a defined cohort and selecting a specified number of matched controls from among members of the cohort who have not developed the disease by the time the disease occurs in the case. Massive epidemiologic cohort studies, on the other hand, frequently necessitate the long-term observation of thousands of people. Compiling the information of all cohort members could take a long time and cost a lot of money. The study designs, such as nested case-cohort study designs, have been proposed to save money while accomplishing the same purpose as a cohort study [18].
Example: Using a nested case-control design, the effect of milk feed type and changes in milk feed type in the development of necrotizing enterocolitis in preterm infants were evaluated. The researchers selected a comparable sample of controls using matching from the same population as the cases. They compared the cases and matched controls at the point of the event and looked into the temporal relationship between feed type and necrotizing enterocolitis [19].
Multiple Cohort Studies:
Multiple cohort studies are set up with one or more different subject groups. There is one or more groups with no exposure or exposure at a lower level than the one group having exposure to a potential risk factor. The researcher creates suitable cohorts with varying exposure to the predictor of interest, measures other predictor variables, monitors the cohorts, and evaluates the results as with any other kind of cohort study.
Example: A triple cohort research was conducted to assess whether severe newborn jaundice or dehydration hurt baby neurodevelopment. Initially, the investigators used electronic databases to form samples into three groups. The first group had a blood bilirubin level of more than 25%, whereas the second group was readmitted for dehydration with a higher serum sodium level and a weight loss of more than 12% since birth. The third group was selected at random from the birth cohort. The investigators performed neurological exams on these three groups at regular intervals, while maintaining blinding of the groups. Finally, the results were compared between the groups, and it was found that neither hyperbilirubinemia nor dehydration was connected with adverse outcomes[20].
Steps of a Cohort Study:
There are four fundamental steps in designing and conducting a cohort. Let us take a hypothetical example of a cohort study titled “The Prevalence, determinants, and outcomes of PGDM among pregnant women” to illustrate the steps of a cohort study.
Step 1: Selection of “cohorts”: The first step is to select the cohorts for the study. This can be done either as a single-cohort design or as a double-cohort design. In a single-cohort design, a group of the population is selected that didn’t have the outcome. When the outcome developed, the population was divided into two groups: the exposed group and the nonexposed group (internal control). Comparison of variables is taking place between these two groups. In a double cohort design, one group is exposed to predictor variables and another group is selected without exposure to the predictor variables (external control). And these two groups are compared to know the development of the outcome[7].
In the above-mentioned hypothetical example, the researcher will recruit pregnant women from OPDs during their initial period of pregnancy. The study participants will undergo blood investigations to identify Pre-gestational Diabetes Mellitus (PGDM) among them. Thereafter, they will be divided into two groups -those with PGDM and those without PGDM. This is an example of a single-cohort group with internal control.
Step 2: Gathering data regarding potential causes of exposure: Exposure information can be gathered from a variety of sources, including Cohort members, record reviews, medical examinations or special tests, environmental assessments, and other sources [21]. Data should be collected in such a way that cohort members can be classified based on their level or degree of exposure, at least in broad classifications[6].
In the hypothetical example, the researcher probably would like to gather information regarding the causes from the two groups through physical assessment and history-taking, and by administering questionnaires.
Step 3. Comparison group selection: Members of several cohort studies were divided into different comparison groups based on their levels or amounts of risk exposure before the disease's onset. This is known as an internal comparison. When information on the degree of exposure is unavailable, an external control must be constructed to evaluate the exposed group's experience. A comparison with general population rates could also be performed. Researchers initially assess whether a causative factor is associated with disease development by comparing outcomes between exposed and non-exposed groups. If there is a substantial association between the exposure and the disease, we would expect a higher proportion of the exposed group to develop the condition than the non-exposed group[7,10,22].
The above-mentioned hypothetical single-cohort study is an example of internal comparison, where the researcher would like to do a comparison of variables between PGDM and non-PGDM groups to identify the risk factors of PGDM. In a double cohort study, the researcher compares the variables between PGDM with an external control group of pregnant women without PGDM, an example of external comparison.
Step 4. Follow-up: The last step of the cohort study is follow-up. The common methods of follow-up are as follows: periodic medical examinations, evaluation of physician and hospital records, death record surveillance, and home visits[21].
In the hypothetical example, both PGDM and non-PGDM groups will be followed up to the birth of the baby, both mother and baby, to identify the outcomes among them. The development of diseases among both groups will be compared. This comparison will enable us to examine the association of various outcomes with PGDM.
Statistical Approaches in Cohort Studies
The ultimate objective of epidemiological approaches is to identify the factors that either increase or decrease a disease's risk. To assess the problem's magnitude when the exposure exists versus when it is not, we need to have knowledge of exactly what size the problem is. The prevalence and incidence of the disease provide an idea of the magnitude of the problem[23].
Estimating the frequency of a dichotomous outcome
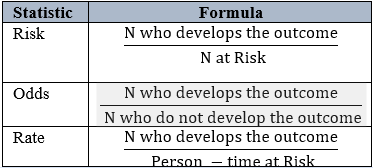
In a cohort study, odds, risks, and rates are used to estimate the frequency of a dichotomous outcome. These three are closely related, sharing the numerator – the number of persons who developed the outcome[24]. The formulas for calculating the odds, risks, and rates are given in the table.1
Estimation of Risk Difference (RD) / Attributable Risk (AR)
Risk Difference (RD) indicates the amount of the disease rate that is attributable to the exposure or risk factor. It is also called attributable risk. Risk difference is a useful index from the public health point of view. For example, a health administrator would like to know the number of lives that would be saved if the incidence of cardiovascular disease is reduced through the avoidance of junk food.
RD can also be used as an indicator of the effectiveness of different types of treatments or interventions in a trial setup.
Risk Ratio (RR) or Relative Risk
Relative risk, often known as the incidence risk ratio, measures the correlation between exposure and disease. The ratio represents the probability of contracting a disease in the group that was exposed compared to the group that was not exposed

If the risk of disease in the exposed group is greater than the risk in the unexposed group, the relative incidence risk is above one, and the exposure is considered a risk factor. On the other hand, if the risk of disease in the exposed group is lower than the risk in the unexposed group, the RR will be less than one, indicating that exposure is a protective factor. If the risk is the same whether the exposure is present or not, the RR will be one, indicating that the factor under examination is not related to the diseasen[6,24].
Incidence Density (ID):
In some cases, there is a possibility of developing the disease among the samples in different periods, different lengths of follow-up needed, and there are different probabilities of developing the disease; the unit of analysis can't be a person or subjects. Under these circumstances, we find the person time units of follow-up such as Person-years or Person -months and relate the number of events to the total person times to arrive at an index called incidence density (ID)

While calculating ID, we assume that the incidence rate is constant throughout the follow-up period. Incidence Density can vary from zero to infinity [24].
Regression Analysis in Cohort studies
In cohort studies, there will be a well-defined outcome and different clinical, biochemical, and socio-demographic factors that are suspected to have a role in the outcome. When an exposure variable shows a significant association with the outcome, it might be partially or wholly due to the influence of other factors that are associated with this exposure variable. In these cases, multivariable regression analysis is the best option. Examples include Linear regression, Logistic regression, survival analysis, cox regression, and Poisson regression [23].
In cases of a significant loss to follow-up, it is better to compare the incidence of disease between the groups – the number of outcomes divided by the person's time at risk. The cox proportional hazard model provides a method for multivariate analysis of data of this form (sometimes called “time to event “data): it allows estimation of “hazard ratios” which are similar to rate ratios and have come into widespread use as the measure of association in Cox regression analyses.
Landmark cohort studies:
Cohort studies have contributed to the advancement of medical research since earlier times. Some milestones in cohort studies are listed below.
Smoking and lung cancer studies:
In 1951, Doll and Hill undertook a study to evaluate the relationship between smoking and lung cancer. They delivered questionnaires about smoking habits to around 60,000 medical doctors in the United Kingdom. Based on the responses, they divided the cohort into two groups: smokers and nonsmokers. Participants in the study were followed for approximately four and a half years. Following the participant's death, each death certified as the result of lung cancer was confirmed by contacting the physician who certified the death. The study's findings demonstrated that, as compared to other types of fatalities analysed, lung cancer mortality rates consistently grow as tobacco usage increases [25].
Framingham Heart Study:
The United States Public Health Agency launched the Framingham Heart Study in 1948 to investigate the link between a range of risk factors (for example, serum cholesterol, blood pressure, weight, smoking) and the development of cardiovascular disease. Because of the gradual progression of heart disease, this trial was scheduled to last 20 years. The study samples were examined for the first time at the preliminary stage. The study population was assessed every two years for the next 20 years following the initial assessment. The study's findings demonstrated that risk factors for heart disease include smoking, high blood pressure, high cholesterol, bad eating habits, physical inactivity, and unhealthy weight. This research has produced ground-breaking findings on managing heart disease [26].
Nurse’s Health Study (NHS):
To date, there are three Nurse’s Health Study cohorts: NHS Original, NHS II, and NHS III. The original NHS was started in 1976 by researchers from the Brigham and Women's Hospital Channing Laboratory and Chan School of Public Health. It gathered registered nurses ages 30-55 from around the United States to complete a set of questionnaires. The nurses are followed forward to assess lifestyle behaviours or other characteristics to see if they develop a disease, die, or have a specified outcome. The robust findings from the NHS's study led to the evidence base for formulating the US Dietary Guidelines to lower intakes of trans fat, saturated fat, sugar-sweetened beverages, red and processed meats, and refined carbs while advocating a higher intake of healthy fats and carbohydrates. NHS studies on the advantages of physical activity helped to build the evidence underpinning the Physical Activity Guidelines for Americans. NHS studies on cancer survivorship also helped shape the Nutrition and Physical Activity Guidelines for Cancer Survivors [27].
Challenges in undertaking Cohort studies:
The common challenges faced during cohort studies are listed below with a brief description.
- Selection Biases: A selection bias is an error that occurs during the design and implementation of sampling, selection of groups, and allocation of groups The intervention and comparison groups may differ in specific aspects that impact the outcome depending on the criteria that decided whether an individual received an intervention. This might be due to the preferential selection of individuals to get the intervention or individual decisions. To reduce the selection bias, it is advised to choose suitable comparison groups, identify and evaluate the comparability of any possible confounders between the groups, and employ suitable statistical techniques in the analysis [10].
- Confounding Bias: Confounding bias is the net result of selection bias. As patients were not randomly assigned to their respective groups when comparing subgroups of interest, several confounding variables can complicate data analysis and interpretation. A significant bias can be established if the quality and amount of the information obtained differ between exposed and non-exposed people. This is especially prevalent in historical cohort studies, where information is collected from old records [28]. Strategies to minimize confounding bias are as follows
Design phase: By restricting certain classes of confounding factors (e.g., male) in participation in the research. Controls and cases are matched to improve fair representation of participants with specific confounders across research groups[10].
Analytical phase:
- Stratification: Based on characteristics that might skew the study, the sample is divided up into subgroups or strata (e.g., age)[10].
- Statistical adjustments
- Regression: Once the impacts of other variables have been taken into account, regression computes the relationship between each independent variable and the dependent variable[10].
- Propensity score: Out of the observable variables that may affect the chance of exposure, a propensity score is the conditional probability of exposure to an intervention[10].
- Instrumental variable: a pseudo-randomization technique that splits patients based on the presence or absence of a covariate linked to the exposure but unrelated to the result[10].
Attrition: Despite the greatest efforts, a certain percentage of follow-up losses are unavoidable owing to death, change of location, migration, or withdrawal of occupation. These losses may bias the outcome. As a result, a mechanism for getting basic information on the outcome for individuals who cannot be followed up on in-depth for the duration of the study must be integrated into the study design. It is recommended to get as close to a 95% follow-up rate as possible[21]. Strategies used to minimize follow-up losses are as follows
During Enrolment:
- Exclude those likely to be lost like planning to move, ill health or fatal disease unrelated to the research question.
- Obtain information to allow future tracking like the address, telephone number, and email address of the subject
During Follow-up: 1 Periodic contact with subjects to collect information, provide results, and be supportive
For those who are not reached by phone or email: contact friends, relatives or physicians
At all times: Treat study subjects with appreciation, kindness and respect, helping them to understand the research question so they will want to join as partners in making the study successful[29].
Information Bias: If the researcher evaluating whether the disease has developed in each subject also knows if that subject was exposed and is aware of the hypothesis being tested, that person's judgment on whether the disease occurred may be biased. This issue can be solved by disguising the person performing the disease evaluation and establishing whether or not this person was aware of each subject's exposure status. As with any study, if the epidemiologists and statisticians examining the data have strong preconceptions, they may accidentally infuse their biases into their data analyses and interpretation of the study conclusions[28].
Missing data: Due to long periods of follow-up missing data can be an issue in cohort studies. There are statistical methods to handle missing data in studies – such as complete case analysis, available case analysis, single imputation, or multiple imputations. Getting expert statistical advice would be recommended to choose the correct method of imputation[29].
Appraising Cohort studies :
Various checklists are available for appraising cohort studies. Critical Appraisal Skill Program (CASP) checklist on cohort studies guides to perform critical evaluation of cohort studies. There are 12 questions to help you make sense of a cohort study. These are based on three broader areas like results of the study, it’s validity and whether the results help locally”? The questions are checking whether the study address a focused issue, recruited an acceptable cohort, accurately measured exposure and outcomes, identified confounding factors, and followed subjects for sufficient duration. The results were precise, reliable, and applicable to the local population. The study's findings fit with available evidence and have implications for practice [30].
Reporting of Cohort Studies :
STROBE (STrengthening the Reporting of OBservational studies in Epidemiology) stands to guide how to report observational studies. The checklist provides recommendations on how to produce observational research reports, improve their completeness and transparency, and promote critical assessment and interpretation of findings. The STROBE guidelines are intended to help guide the reporting of observational epidemiological research[31].
Strengths of cohort study:
One of the greatest advantages of the cohort design is that, in contrast to other epidemiological studies, it makes it possible to determine the incidence of a disease. Measuring predictor levels prior to the result provides the temporal sequence of variables, which is used to infer the causal foundation of the relationship. The prospective strategy also ensures that predictor measures are not impacted by the result or knowledge of its occurrence. Cohort studies also create a great deal of data that can be evaluated from various perspectives. Cohort studies can provide more accurate information on the primary exposure and confounding variables. Certain types of bias, such as misclassification of individuals into exposed and unexposed groups, can be reduced because comparison groups are formed before disease develops. Cohort studies are preferable designs for adding evidence-based practises in some circumstances where the exposure being studied is rare or there may be ethical problems that prevents you from using a conventional experimental design[9,10].
Limitations of cohort study
Cohort studies often take a long time to conduct and acquire findings, during which time the investigators may have died or the participants' classification may have changed. It's indeed anticipated that a considerable percentage of the initial cohort will be lost owing to migration, loss of interest in the study, or simply refusing to provide any necessary information. With time, the disease's conventional procedures or diagnostic criteria may change. Furthermore, cohort studies are expensive because of the large number of individuals recruited for the study and it’s inevitable nature of the follow-up[8,9]. One notable deficiencies of the prospective approach are its inefficiency in researching rare disease. Even diseases that we consider to be rather prevalent, like as breast cancer, occur at such a low incidence in a single year that vast numbers of patients must be studied for extended periods of time to provide relevant results.
Conclusion
In cohort studies, a group of subjects is initially identified and followed over a long period of time to describe the incidence of a condition and to describe the predictors for various outcomes. The ability to measure the predictor before the outcome occurs establishes the sequence of events and controls bias in that measurement. A prospective cohort begins with predictor variables and observes the development of the outcome among the subjects, so it may need a large quantity of data to reach interpretations. The latter disadvantage can be avoided by using a retrospective cohort with previously measured predictor variables. Risks, odds, and rates are three ways to estimate the frequency of dichotomous outcomes during the follow-up of cohort studies. The strength of cohort studies can be ensured by reducing the loss of follow-up of its subjects. Cohort studies produce a lot of data that can be examined from different perspectives
Acknowledgments
The authors acknowledge Mrs. Renjitha Bhaskaran (Lecturer, Department of Biostatistics, Amrita Hospitals, Kochi) for reviewing the statistical part of the manuscript.
Conflicts of Interest
The authors declare no conflict of interest.
Sources of funding and support
The authors received no funding related to this article.
Author contributions statement
All authors contributed equally.
Competing interest policy
The authors declare no competing financial and/or non-financial interests concerning the article
Clinical trial number
not applicable
Ethics, Consent to Participate, and Consent to Publish declarations
Not Applicable.
References
-
Frérot M, Lefebvre A, Aho S, et al. What is epidemiology? Changing definitions of epidemiology 1978-2017. PLOS ONE. 2018;13:e0208442. doi: 10.1371/journal.pone.0208442
View at Publisher | View at Google Scholar -
DiPietro NA. Methods in epidemiology: observational study designs. Pharmacother J Hum Pharmacol Drug Ther. 2010;30:973–84.
View at Publisher | View at Google Scholar -
Song JW, Chung KC. Observational studies: cohort and case-control studies. Plast Reconstr Surg. 2010;126:2234.
View at Publisher | View at Google Scholar -
Cook DA, Beckman TJ. Reflections on experimental research in medical education. Adv Health Sci Educ. 2010;15:455–64.
View at Publisher | View at Google Scholar -
Cataldo R, Arancibia M, Stojanova J, et al. General concepts in biostatistics and clinical epidemiology: Observational studies with cross-sectional and ecological designs. Medwave. 2019;19.
View at Publisher | View at Google Scholar -
Park K. Park’s textbook of preventive and social medicine. Prev Med Obstet Paediatr Geriatr. 2021.
View at Publisher | View at Google Scholar -
Mann C. Observational research methods. Research design II: cohort, cross sectional, and case-control studies. Emerg Med J. 2003;20:54–60.
View at Publisher | View at Google Scholar -
Setia MS. Methodology series module 1: Cohort studies. Indian J Dermatol. 2016;61:21.
View at Publisher | View at Google Scholar -
Barrett D, Noble H. What are cohort studies? Evid Based Nurs. 2019.
View at Publisher | View at Google Scholar -
Gordis L. Epidemiology e-book. Elsevier Health Sciences 2013.
View at Publisher | View at Google Scholar -
Sedgwick P. Prospective cohort studies: advantages and disadvantages. Bmj. 2013;347.
View at Publisher | View at Google Scholar -
Nambiar V, Raj M, Vasudevan D, et al. One-year mortality after acute stroke: a prospective cohort study from a comprehensive stroke care centre, Kerala, India. BMJ Open. 2022;12:e061258.
View at Publisher | View at Google Scholar -
Sedgwick P. Retrospective cohort studies: advantages and disadvantages. Bmj. 2014;348.
View at Publisher | View at Google Scholar -
Amini M, Mansouri F, Vafaee K, et al. Factors affecting the incidence and prevalence of pressure ulcers in COVID‐19 patients admitted with a Braden scale below 14 in the intensive care unit: retrospective cohort study. Int Wound J. 2022;19:2039–54.
View at Publisher | View at Google Scholar -
Sahile Z, Tezera R, Haile Mariam D, et al. Nutritional status and TB treatment outcomes in Addis Ababa, Ethiopia: an ambi-directional cohort study. Plos One. 2021;16:e0247945.
View at Publisher | View at Google Scholar -
Sessler DI, Imrey PB. Clinical research methodology 2: observational clinical research. Anesth Analg. 2015;121:1043–51.
View at Publisher | View at Google Scholar -
Thamakaison S, Anothaisintawee T, Sukhato K, et al. Hemoglobin A1c in combination with fasting plasma glucose trumps fasting plasma glucose alone as predictive indicators for diabetes mellitus: an ambidirectional cohort study of Thai people with impaired fasting glucose. BMJ Open Diabetes Res Care. 2021;9:e002427.
View at Publisher | View at Google Scholar -
Soyoung K. Case-cohort studies vs nested case-control studies. Datum. 2016;22:1–2.
View at Publisher | View at Google Scholar -
Partlett C, Hall NJ, Leaf A, et al. Application of the matched nested case-control design to the secondary analysis of trial data. BMC Med Res Methodol. 2020;20:117. doi: 10.1186/s12874-020-01007-w
View at Publisher | View at Google Scholar -
Newman TB, Liljestrand P, Jeremy RJ, et al. Outcomes among newborns with total serum bilirubin levels of 25 mg per deciliter or more. N Engl J Med. 2006;354:1889–900.
View at Publisher | View at Google Scholar -
Andrade C. The Young Researcher’s Guide to Starting a Cohort Study. Indian J Psychol Med. 2022;44:523–4.
View at Publisher | View at Google Scholar -
Polit DF, Beck CT. Essentials of nursing research: Appraising evidence for nursing practice. Lippincott Williams & Wilkins 2010.
View at Publisher | View at Google Scholar -
Hulley SB, Cummings SR, Newman TB, et al. Designing cross-sectional and cohort studies. Des Clin Res. 2013;4:85–96.
View at Publisher | View at Google Scholar -
Sundaram KR, Dwivedi SN, Sreenivas V. Medical statistics: Principles & methods. Anshan 2010.
View at Publisher | View at Google Scholar -
Doll R. Lung cancer and smoking. J R Soc Health. 1957;77:247–54.
View at Publisher | View at Google Scholar -
Mahmood SS, Levy D, Vasan RS, et al. The Framingham Heart Study and the epidemiology of cardiovascular disease: a historical perspective. The lancet. 2014;383:999–1008.
View at Publisher | View at Google Scholar -
Colditz GA, Philpott SE, Hankinson SE. The impact of the Nurses’ Health Study on population health: prevention, translation, and control. Am J Public Health. 2016;106:1540–5.
View at Publisher | View at Google Scholar -
Andrade C. Research design: cohort studies. Indian J Psychol Med. 2022;44:189–91.
View at Publisher | View at Google Scholar -
Sterrantino AF. Observational studies: practical tips for avoiding common statistical pitfalls. Lancet Reg Health-Southeast Asia. 2024;25.
View at Publisher | View at Google Scholar -
Critical A, Programme. CASP(Cohort Study)Checklist. Online. 2018.
View at Publisher | View at Google Scholar -
Von Elm E, Altman DG, Egger M, et al. The Strengthening the Reporting of Observational Studies in Epidemiology (STROBE) statement: guidelines for reporting observational studies. The Lancet. 2007;370:1453–7.
View at Publisher | View at Google Scholar